
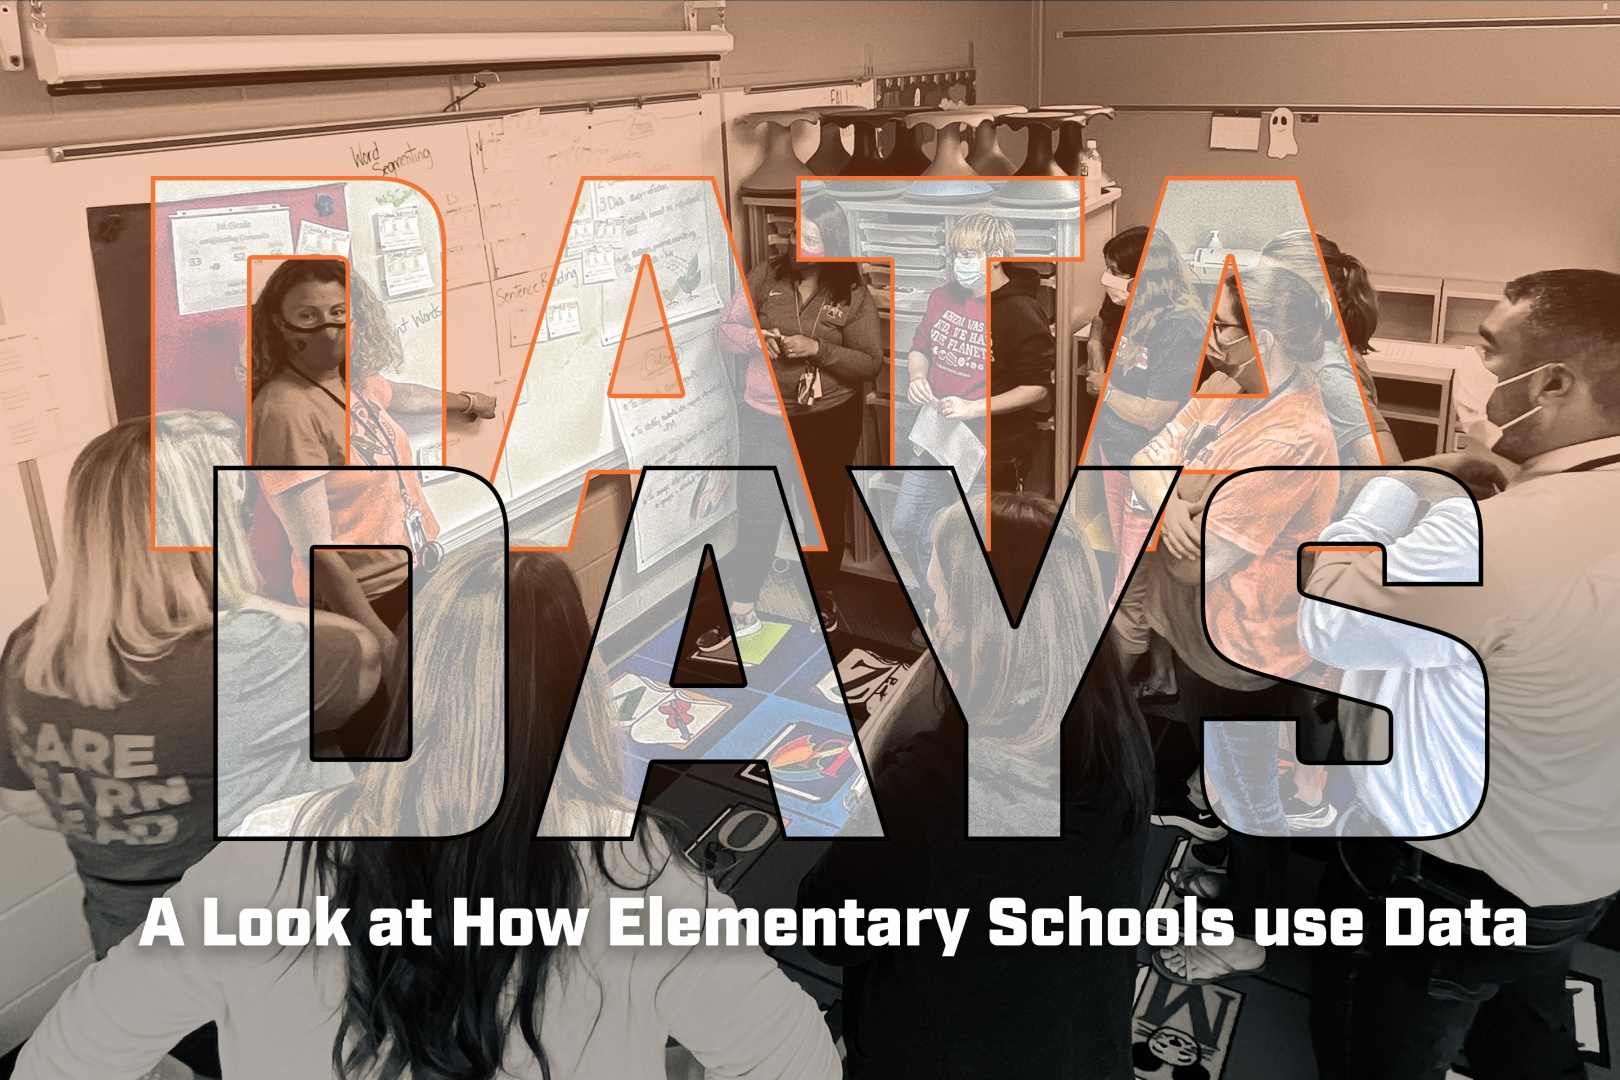
Data Days: A Look at How Data is used at Elementary Schools
Data days at our elementary schools allow teachers to investigate areas of instructional need using data and respond with reading interventions to close gaps. Grades K-1 use FAST benchmark data, and grades 2-5 use MAP data as it relates to school and individual students. The purpose of these structured meetings is to assess data, analyze grade-level trends, and identify students for additional instruction.
Looking at data in the fall “can give teachers a great baseline for further investigation as they begin to understand what their students need in reading and math,” according to Director of Teaching and Learning Erin Miller. “As the year goes on, teachers will look at multiple data sets to ensure they accurately understand what students already know and what they still need to learn. Teachers then design instruction to ensure students are getting the support they need to meet and exceed grade-level standards.”
Teachers meet formally at least three times a year but informally more often. Beyond the benchmark FAST and MAP data sets, they also analyze additional data to help diagnose the area of instructional need. This approach ensures that students are being met with targeted instruction, increasing learning at an accelerated pace.
On October 4, teachers in grades 2-5 participated in professional development centered around MAP reporting. This was a District-led training to help support teachers in their use of data. MAP is the universal screener for reading that helps supports students by informing instruction and intervention planning.
During the time set aside specifically to look at data, teachers are looking for school-wide trends and individual students. Assistant Principal at Fellows Elementary Mary Morton leads this data work at her building. “The collaborative nature of these data meetings is incredibly powerful. Grade-level teachers are able to analyze student data with all of the experts in the building who know each student, instructional strategies, and grade-level standards to respond to data in an artful and responsive way.”
When looking at the data presented to them, teachers ask three questions: 1) What do I notice about the data? 2) What do I wonder about the data?, and 3) What grade level trends do I notice? The school-wide data shows teachers how they are collectively moving together to meet student needs. Still, the individual analysis identifies which students have not met the seasonal benchmark. Doing this work throughout the year, but specifically in the fall, allows teachers to make needed adjustments to improve student performance.